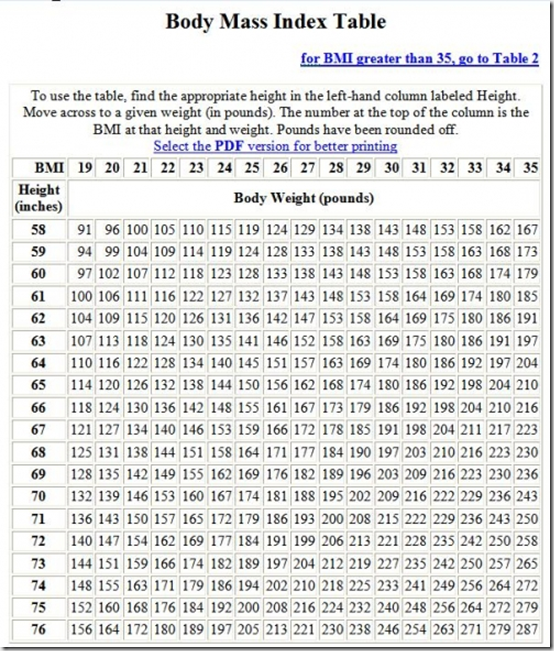
No need for a calculator with this BMI chart I can’t recall where I got it. It’s been sitting in my Misc images for so long. Obviously if someone is a body builder it doesn’t really work for them, but it is better than the old insurance height-weight charts as far as giving you a reasonable range. Although the old height-weight charts took three body type frames into account, this may allow someone with a really small frame be at the top of the healthy range BMI and think it’s all ok when really it is too much weight for their frame size. Those old charts though used to give you about a 5 pound range in your frame type and that was it. I never felt like I fit in there cause i wasn’t quite small frame or medium.
This table doesn’t offer the cutoffs though hmm they are:
Underweight 18.5 or less (so off the chart to the left)
Healthy 18.5 – 24
Overweight 25 – 29.9
Obese 30 or more
For me that makes the healthy range 95 pounds to 127 that is a range of 32 pounds. I have a medium frame, well really i have a small frame but am heavily muscled so I don’t have the tiny muscles like a Japanese woman for example. I think a small Japanese woman could be 94 or 95 pounds easy and look normal for her frame and muscle density. If I were 95 pounds though I would look anorexic, and have no boobs at all. While it’s possible I may be healthy at 127, I think it is too much for me. When I was in my late teens and early twenties I was between 98 and 103 depending on my menstrual cycle and that was about as thin as my body should ever be. In 2002 I was about 118 and felt good at that weight in terms of health and I think that really is as heavy as my body should ever be. So that is a range of 20 pounds. That seems more reasonable to me, than a range of 32 pounds. (excluding pregnancy of course but at 46 I don’t really need to deal with that)

